How to Use the Map
Interactive Map Tutorial
Navigating the Map
- Pan: Left-click on the map and drag.
- Zoom: Use the zoom control on the top-left of the map or use the mouse wheel.
- Home: Click on the home symbol in the top-left of the map to return to the original extent of the map.
- Fullscreen: left-click on the icon in the bottom-right of the map. Do the same to exit fullscreen.
Base Map
- Left-click on “Satellite” in the top-right of the map to display a satellite base map. Left-click on “Terrain” to return to the terrain base map.
Get Sample Details
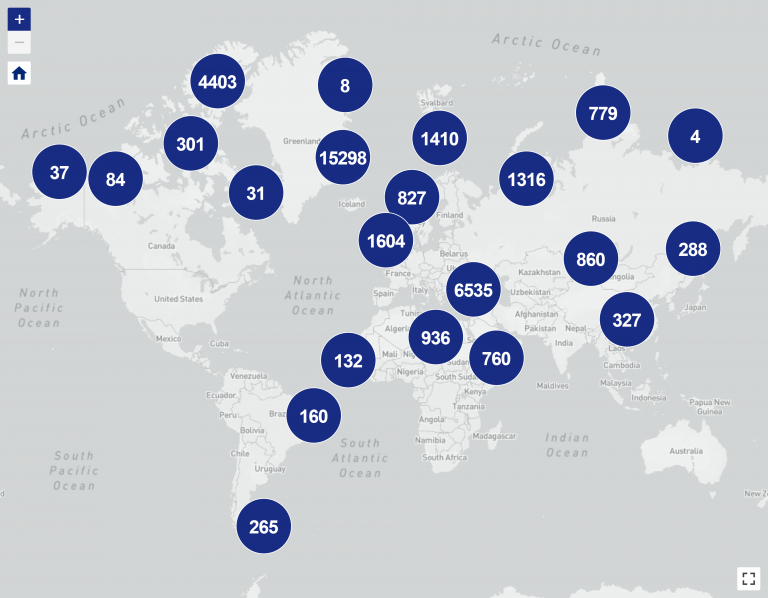
- Left-click on a sample cluster to expand it until an orange sample icon appears. Left-click on this icon to display a pop-up for that sample. If the sample is associated with an active or recently completed project, left-click on the URL to the right of “Project Code“.
Filter the Samples
- Left-click on the “Sample Filters” menu in the top-right of the map to expand the “Project Series”, “Primary Lithology” and “Chronostratigraphy” filter categories.
- Check the options you wish to filter across one or all categories. Left-click “Run Filters” at the top of the “Sample Filters” menu.
- To reset the filters, left-click on the “Sample Filters” menu and then left-click on “Clear Filters” option.
- You do not need to “Clear Filters” before running a new filter.
Spatial Search
- Left-click the radio button for reports, samples or both in the bottom-left of the map depending on what you want to search.
- Left-click on the “Draw search area” icon in the bottom-left of the map.
- Move the cursor to a position on the map and then hold down the left mouse button and drag to draw a rectangle.
- A results table will open and only samples within the search area will be shown on the map.
- To reset the search, left-click on the “Reset search” icon.
- If a “Sample Filters” option has been applied this will remain active in the spatial search. A “Sample Filters” option can also be applied after a spatial search.
Results Table
- If both reports and samples are searched, then reports are listed first. To display the list of samples click on the “### samples found (-/+)”. Only the first 1000 samples are returned, but all reports are listed for the search area.
- Clicking on the “### reports found (-/+)” and “### samples found (-/+)” row, whichever is active, will collapse the table and vice versa.
- The mouse wheel can be used to scroll up and down the table.
- The reports are listed in order from smallest to largest area of relevance.
- Left-clicking on a report record will display its area of relevance as well as a pop-up with more information including hyperlinks to a dedicated report page, any active/recently completed projects and geographical region/subregion pages.
- Left-clicking on a sample record will navigate to it and a pop-up will appear with more information. If the sample is associated with an active or recently completed project a hyperlink will be shown.
Missing Sample Information
- There is an active program to database our legacy material, but some information is yet to be entered and is recorded as “Not Entered”. Those fields with missing information are not displayed in the sample pop-ups.
Tablet and Mobile Devices
- The Spatial Search and Results Table are not available on tablet nor mobile devices.
More Information
For more information about CASP’s data holdings please contact the Geoscience Data Coordinator: Simon Passey
Interactive Map